


Reporting and analytics built around your business decisions

Remote reporting and analytics for teams worldwide, with clear metric definitions and validated data using Power BI or Qlik Sense where they fit your licences and questions.

Discuss reporting and analytics

Team reviewing plans on a board. Stock photography for illustrative context.
Illustrative example. This is not a customer workshop or result.

What the work covers

Reports that answer the questions you actually ask

Stakeholder questions, source readiness, semantic or data models, metric definitions, dashboard design, access, validation and handover. Predictive modelling is not a standard inclusion unless it is scoped separately.

Any dashboard shown in conversation is labelled as an example or as a customer-approved case. We do not publish confidential customer data on this website.
Deliverables

What teams receive from an analytics engagement

  • Metric definitions

    Agreed meanings so totals stay consistent across reports.

  • Models

    Semantic or data models suited to Power BI or Qlik Sense.

  • Dashboards

    Views built around the decisions your stakeholders make.

  • Access

    Who can see which reports, documented for handover.

  • Validation

    Source checks for published metrics before go-live.

  • Handover

    Instructions your team needs to keep numbers trustworthy.

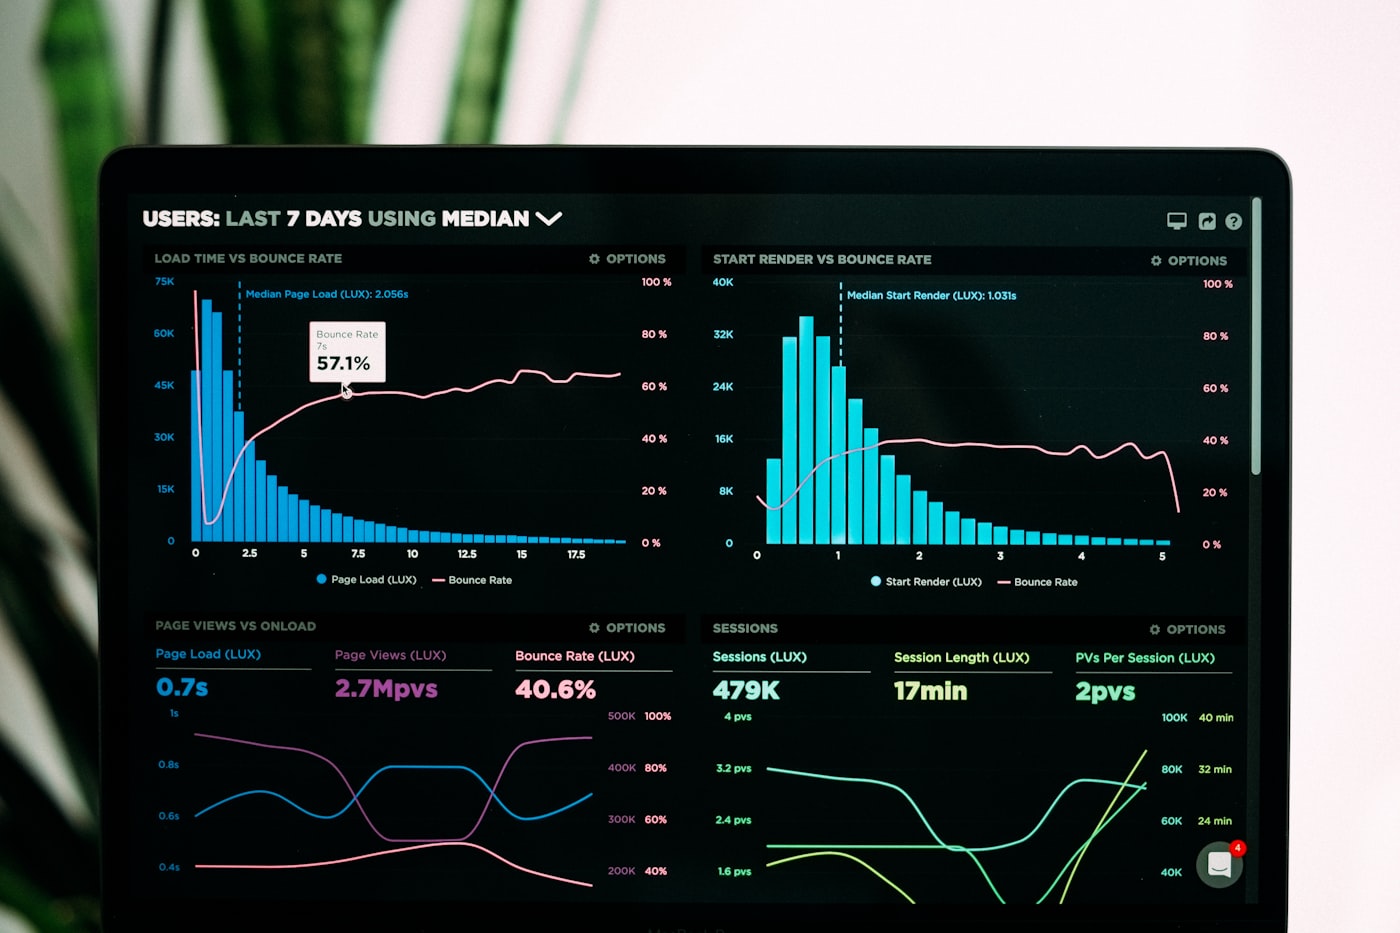
Charts on a monitor. Stock photography for illustrative context.
Illustrative example. This is a sample visual only, not actual customer results.

How the work runs

Questions, model, build, validate

  1. Questions. Capture the decisions the report must support.
  2. Model. Confirm sources, definitions and platform fit.
  3. Build. Design dashboards with agreed access.
  4. Validate. Reconcile metrics and hand over documentation.

Questions

Common questions about reporting

Can you improve an existing report?

Yes. Many engagements start with a report that is slow, unused or no longer trusted.

Which platform is appropriate?

We work with Power BI and Qlik Sense. The choice depends on your existing licences, skills and the questions the report must answer.

How are numbers reconciled?

Each published metric has a definition and a source check. We do not treat a polished chart as complete without that.

What does the team receive?

The agreed reports, access instructions and the metric definitions needed to keep the numbers consistent.

Discuss reporting and analytics

Tell us which decisions the reports need to support.

Discuss reporting and analytics